Friday 23 April 2021

ANZAC Day - 25 April 2021

                                                                                                    Shutterstock

ANZAC Day and the sacrifice of the servicemen and women in time of war and conflict becomes momentarily, centre-stage. According to the Australian War Memorial, a total of 102,911 Australians have lost their lives as a result of service with Australian units since 1885. The range of wars, police actions, regional conflicts and disaster recovery is diverse in scale and duration as demonstrated below. The dates of the conflicts and actions are adjusted as many service personal died later as a result of their injuries or as a result of post war reconstruction activities such as occupation forces or mine and ordinance clearance.

Conflict

Dates

Mortalities

Sudan

1885

9

South Africa

1899-1902

589

China

1900-1901

6

First World War

1914-1921

61,605

Second World War

1939-1947

39,654

Australia: bomb removal

Japan – Occupation force

1947-1950

1947-1952

4

3

Papua and New Guinea

1947-1975

13

Middle East (UNSTO)

1948

1

Berlin Airlift

1948-1949

1

Malayan Emergency

1948-1960

39

Kashmir – UN observer

1948-1985

1

Korean War

1950-1953

340

Malta

1952-1955

3

Korean War – Armistice

1953-1957

16

Southeast Asia (SEATO)

1955-1975

10

Indonesian Confrontation

1962-1966

22

Malayan Peninsula

1964-1966

2

Vietnam War

1962-1975

521

Thailand

1965-1968

2

Irian Jaya

1976-1981

1

Western Sahara (MINURSO)

1991-1994

1

Somalia

1992-1994

1

Bougainville

1997-2003

1

East Timor

1997-2003

4

Afghanistan

2001 - present

43

Iraq

2003-2013

4

Solomon Island (RAMSI)

2003-2013

1

Indonesia (Sumatra Assist)

2005

9

Fiji

2006

2


Lest we forget

Wednesday 21 April 2021

Climate change - the challenge of not exceeding a 1.5 degree Celsius increase

                                                                                         Shutterstock
Global management consulting firm, McKinsey & Co, has provided a simple summary of the impact of a 1.5 degrees Celsius increase in temperature and the solutions to prevent crossing this critical threshold. These can be listed as -

Impacts
  • weather events become more extreme and frequent. These include wildfires, hurricanes, severe storms, drought, flooding and very high temperatures.
  • climate feedbacks occur such that climate change triggers changes on the planet which lead to further changes in the climate and an ongoing cycle occurs becoming self-reinforcing. The higher the temperature, the greater the effect.
  • climate feedback include higher temperatures contributing to the loss of forests which in turn lead to the loss of carbon capture, increased carbon release and correspnding higher climate change levels.
  • loss of ice cover warms the Earth with less reflective cover from the sun and hence contributes to further temperature increase.
  • the current situation where climate change can already been felt is the result of an increase of 1.1 degrees Celsius.
Solutions
  • 75% of emissions of CO2 relate to energy production and use so this is a primary focus.
  • power companies have been moving away from traditional coal and gas burning and moving to renewables such as solar and wind power. Clean hydrogen or green hydrogen is the new growth opportunity.
  • Carbon capture and storage is essential to get CO2 out of the atmosphere. This is best achieved through reforestation since plants absorb carbon. However each year an area the size of Greece is being deforested. McKinsey & Co believe that by 2030, reforestation would need to be the size of Turkey.
  • food production is a major source of the greenhouse gas, methane. Cows are the major source of methane although rice production also contributes to this gas. All the cows on the planet currently generate emissions "roughtly on a par with the United States". This can be addressed though various measure such as less beef consumption, changes to certain breeding and genetic selection, methane inhibitors, feed-mix additive changes.
  • road transport accounts for around 15 per cent of CO2 with electrification of vehicles seen as a viable solution using green generation source and battery storage being the pathway aways from emissions.
  • heating (such as space and water heating associated with buildings) accounts for 5 to 8 per cent of global emissions. The solution is adaption to using green energy sources for power.
  • increased efficiency in production and process optimisation in heavy indsutry is a critical related step. Recycling of steel has been identified as a key influence on reducing emissions.
While various initiatives have been taken to commence applying many of these solutions, including most notably in the private sector, concerted support from National Governments is still needed worldwide in order to effect the transition in multiple industries. To do less will lead to unthinkable failure.

Tuesday 20 April 2021

Plastic not so fantastic - failures in recycling a primary contaminant

                                                                                                      Shutterstock

After decades of seeking mainstream public attention, the dangers of plastic contamination in the environment has finally become accepted across international borders. Alas, this recognition has only occured now that the problem has reached a critical scale and impact across the world's oceans and reached as far away as Antarctica and the Northern polar region. 

How much plastic is leaking into the ocean ? Estimates are still being calculated however the quantity ranges from 4.8 to 12.7 mega tonnes per year. This is a staggering amount of which 80% of plastics in the ocean originate from land-based sources. 

Plastic is not a single type of manufactured artificial substance but comes in multiple forms. Control, reduction of use and recycling has become a critical issue in the world's environment and continuing failures have led widespread plastic contamination across the world. Ocean litter is commonly found to comprise cigarette butts, food wrappers, bottle tops, plastic bags and straws hence the current moves to ban many of these plastic items.

What are the categories of plastic that are eligible for recycling ? 
  1. at the top of the list is is polythylene terephthalate (commonly referred to as PET) comprises roughly more than half of the the recyclable plastics. It is denoted on packaging with the no "1"
  2. the second most common form is high-density polyethylene (or HDPE) that is denoted by the no "2" on packaging. HDPE comprises a bit over a third of the recycling market and typically is used for packaging (milk and shampoo bottles) and pipes.
  3. next is low density polyethylene which has a "4"on its packaging and is used in clear plastic film. This plastic accounts for around 4% of the recycling market 
  4. also with around 4% of the market is polyproplene which is denoted by the number "5". This plastic is used in yoghurt and food spread containers.
The final group of plastic types have little value in manufacturing and thus no recycling. These are polyvinyl chloride (no "3"), polystyrene (no "6"), other mixed plastics (no "7").

The top exporters of plastic waste in 2019 were the European Union, Japan and the United States with the United Kingdom, Hong Kong, Mexico and Australia being next. The importers of plastic waste comprise predominantly Malaysia, Hong Kong (interestingly), Turkey, the US, Vietnam, Indonesia, Korea, India, Thailand and now much less significantly, China.

The UTS Institute for Sustainable Futures has tracked the movement of plastic waste as shown in the diagram below -
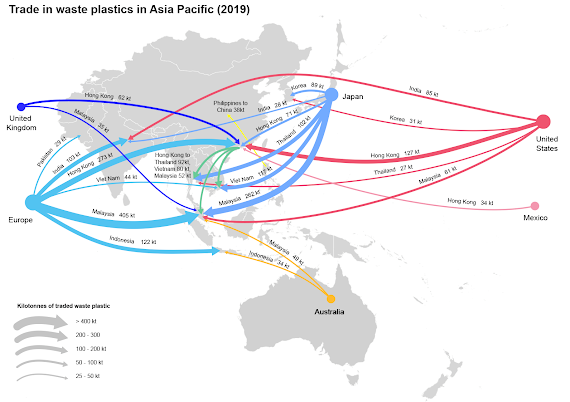
Environmentally responsible trade in waste plastics in the Asia Pacific Region - UTS Institute for Sustainable Futures
The leakage of waste plastic has a variety of reasons - the difficulty in disposal of residual, unrecyclable plastic, no environmental control in processing plastics, poor management of stockpiling and transport of waste plastic, poor quality of bales being exported, labelling of shipments which is false or incorrect, trading at low or negative prices. Waste leakage most often occurs at the destination country rather than the country of origin or during transit according to UTS.

So what are the solutions ?

In a nutshell, there are improvements that can be implemented such as -

  • for exporting countries, improving their collection and sorting of plastics before despatching offshore
  • improving the accountability for shipments for both exporters and importers
  • checking destination processing and monitoring at the importing countries
  • redesign and re-engineering of packaging design and using fewer low value or composite plastics.

Saturday 17 April 2021

Corporate reputation - moral blindness and who can you trust ?

 
                                                                          Shutterstock
Over the past few years multiple corporate scandals, Royal Commissions and Public Inquiries have demonstrated that there is an impact on public perception for companies found to be transgressing ethical standards. Research into community opinion confirms the impact on public perception and provides a warning for various companies as to the precarious nature of their social licence to operate. In equal measure, it is also warning to corporate Boards and their senior executives that there are consequences for engaging in what can be described as 'moral blindness'. Rio Tinto, AMP, the large banks, various technology providers and media organisations being clear examples of companies found wanting.

The Roy Morgan Risk Monitor for 2021 (based on research carried out during 2020) has provided an insight into the current positive or negative standing of various companies - 

Most trusted brands
  1. Woolworths
  2. Coles
  3. Bunnings
  4. Aldi
  5. Qantas
  6. Apple
  7. Kmart
  8. ABC
  9. Microsoft
  10. Myer
Most distrusted brands
  1. Facebook
  2. Telstra
  3. Amazon
  4. NewsCorp
  5. AMP
  6. Rio Tinto
  7. Huawei
  8. Google
  9. BP
  10. Westpac
The ranking of trust and distrust was clearly influenced by the impact of the COVID-19 pandemic, nonetheless this was only one factor influencing the result. Various scandals involving the technology sector (privacy, selling of data to third parties, misleading information publication) have also had an impact.

Wednesday 31 March 2021

The Easter Bunny - tradition, myth or the unknown

                                                                          Shutterstock
Easter, a key set of dates in the Christian calendar, like similar religious commemorations has acquired additional practices, the origins of which are somewhat vague. Easter eggs and hot cross buns are more attuned to the practices of Easter which commence with Palm Sunday, the week before Easter.

The origin of the Easter bunny and its role in being connected to Easter is much more odd with little actual evidence to show how the bunny came to Easter at all.  

The few historical references that the bunny receives, appear in German Lutheran texts around 1572 referring to an Easter Hare which judges children and refers also to eggs. This reference reappears again in 1682 with the text de ovis paschalibus which refers to an Easter Hare bringing eggs to children. In the 18th Century, German migrants to the United States brought the Easter Hare with them with the bunny shaped in sweets.

In 1835 Jacob Grimm, of the renowned Brothers Grimm myth and fairytale writers, was mystified by the Bunny and concluded it may be associated with Ostara (as a sacred animal) and part of the celebration of the resurrection-day of the Christian God but this view was purely conjecture.

The truth is no-one actually knows how the bunny came to Easter but many people have the pleasure of eating a chocolate version nonetheless. Happy Easter !
 
                                                                      Shutterstock

Sunday 21 February 2021

The Pfizer BioNTech vaccine for SARS-CoV-2

                                                                                                   Shutterstock
 As the vaccine roll-out increases world-wide, one of the strongest candidates is the Pfizer BioNTech vaccine. A few facts assist with understanding the strength and value of this vaccine - 
  • The Pfizer vaccine is designated as BNT162b2. 
  • It is a lipid nanoparticle-formulated, nucleoside-modified RNA vaccine encoding a prefusion stabilized, membrane-anchored SARS-CoV-2 full-length spike protein.
  • Pfizer's method has been not to follow a traditional vaccine method that uses inactive, dead or portions of the actual virus to create an immune response but rather utilise mRNA to instruct human cells to develop their own spike protein similar to one found on the surface of coronavirus particles. The result is that a generation of antibodies are generated specifically targetted to the SAR-CoV-2 spike protein.
  • The clinical trial had 43,548 participants in a multinational, placebo-controlled, observer-blinded, pivotal efficacy trial.
  • The vaccine was trialed with each participant receiving two doses, 21 days apart.
  • BNT162b2 was 95% effective in preventing COVID-19 and the efficacy was the same across all subgroups: age, sex, race, ethnicity, baseline body-mass index and co-existing conditions.
  • Side effects were short-term including mild-to-moderate pain at the injection site, fatigue and headache.
  • Of note, the Pfizer BioNTech vaccine can be stored up to 5 days at standard refrigerator temperatures when ready for use. It is essential however for very cold temperatures for initial shipping and longer storage.
The clinical trial results, peer reviewed are published in the New England Journal of Medicine (NEJM) which can be located at this link: Pfizer COVID vaccine results

Pfizer have a simple description of the vaccine on their website: Pfizer: the facts about Pfizer and BioNTechs COVID 19 vaccine