Wednesday, 12 March 2025

Worsening diets in Australia

Fresh fruit down, junk food up: our modelling suggests Australians’ diets will get worse by 2030

Farknot Architect/Shutterstock
Matthew Ryan, CSIRO and Gilly Hendrie, CSIRO

The age-old saying “you are what you eat” rings true – diet quality affects our health from the inside out. While a healthy diet can improve health and wellbeing, a poor diet increases the risk of chronic health conditions such as obesity, diabetes and heart disease.

But Australians’ diets appear to be getting worse, not better. Our new modelling study suggests by 2030, our diets will comprise almost 10% less fruit, and around 18% more junk food. This puts us further away from national targets for healthy eating.

A public health priority

A healthy diet is a priority area of the National Preventive Health Strategy. This strategy sets clear goals to improve diet quality by 2030, including increasing fruit and vegetable intake, and reducing consumption of discretionary or “junk” food.

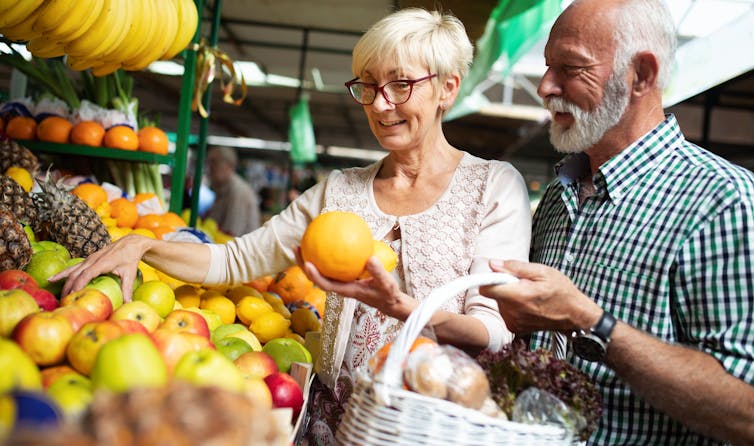
Junk foods (such as cakes, chips, chocolate, confectionery, certain takeaway foods and sugary drinks) are high in saturated fat, salt and sugar, and should only be consumed occasionally and in small amounts.

The preventive health strategy stipulates adults should be consuming two servings of fruit per day and five serves of vegetables, and should be reducing discretionary foods to less than 20% of total energy intake.

Currently, we’re sitting well short of these targets.

We wanted to know whether we might be able to achieve these goals by 2030. So we combined unique data on Australians’ diets with predictive models to map out how our diets are likely to change by 2030.

The CSIRO Healthy Diet Score survey has been running since 2015. This survey uses short questions to measure intake of the five healthy food groups, including fruit and vegetables, as well as discretionary foods. The questions ask about how often people eat certain foods, and how much they eat, to determine an individual’s average daily consumption.

We analysed data from more than 275,000 people who completed this survey between 2015 and 2023. We used predictive modelling techniques called generalised linear models to forecast future diet trends against the national targets. We also broke our findings down by sex and age.

What we found suggests we’re heading in the wrong direction.

A senior couple shopping in a fruit market.
Our research analysed data from more than 275,000 Australians. NDAB Creativity/Shutterstock

Fruit intake down, junk food up

Overall, we found fruit consumption is declining. On average, Australians were eating 0.1 fewer serves of fruit in 2023 than they did in 2015. If this trend continues, we expect a further 9.7% decrease in the average serves of daily fruit to 1.3 serves per day by 2030, well below national targets.

While vegetable consumption appears steady at around 3.7 serves per day, this is well below the recommended daily intake of 5 serves per day.

Concerningly, we are also seeing an increase in consumption of discretionary foods. Average daily intake increased by 0.7 serves between 2015 and 2023, with a further 0.8 serve increase predicted by 2030 (an 18% rise). That’s a 1.5 serve (40%) increase in just 15 years.

We can’t put an exact figure on how junk food intake stacks up against the targets, because we looked at serves per day, while the targets are about the proportion of total energy. However, the figures we identified constitute significantly more than 20% of total energy intake.

Things look worse for women. By 2030, women are predicted to be eating 13.2% less fruit and 21.6% more discretionary foods compared to 2023. For men, our predictions suggest a 4.8% decrease in fruit intake and a 19.5% increase in junk foods.

Despite a greater change in women, men are still predicted to be eating more discretionary foods by 2030 (6.3 serves per day for men versus 4.6 for women).

For Australians aged 30 and above, both fruit and vegetable intake are declining. Adults aged 31–50 have the lowest reported fruit and vegetable intake, but the largest change is in adults 71 and older. For these older Australians, we estimate a 14.7% decrease in fruit consumption and a 6.9% decrease in vegetable consumption by 2030. That’s equivalent to a decrease of 0.5 serves of fruit and 0.2 serves of vegetables since 2015.

A man eating a burger in a restaurant.
Junk food intake is on the rise among all age groups. Estrada Anton/Shutterstock

Discretionary food intake is on the rise in all age groups, but particularly in younger adults.

However, young Australians (18–30 years) may be eating more discretionary foods, but they’re also the only ones eating more healthy food as well. Both fruit and vegetable consumption are increasing for young Australians, with our modelling suggesting a 10.7% and 13.2% respective rise in average serves per day by 2030.

Although this is a positive sign, it’s not enough, as these projections still put young Australians below the recommended daily intake.

Some limitations

Our modelling helps us to understand diet trends over recent years and project these into the future.

However, the research doesn’t tell us what’s driving the worrying trends we’ve observed in Australian diet quality. There are likely to be a variety of factors at play.

For example, many Australians understand what a “healthy balanced diet” is, but what we eat could be affected by social and personal preferences.

It could also be related to cost of living and other pressures which can make fresh food harder to obtain. Also, the area where we live can influence how easy or hard it is to make healthy food choices.

Understanding the root causes behind these changes is a vital area of future research.

In terms of other limitations, our study only focused on the diet quality of Australian adults and didn’t investigate trends is children’s diets.

Also, we only looked at fruit, vegetables and junk food in this study. But we are currently studying changes in the whole diet, taking in other food groups as well.

What can we do?

Australian diets are going in the wrong direction, but it’s not too late to correct the path. We need to ensure all Australians understand what constitutes a healthy diet, and can afford to maintain one.

While no one person, sector or organisation can do this alone, by working together we can put a greater focus towards eating a healthy diet. This includes reviewing policy around the availability and price of fresh fruits and vegetables, as well as looking at our own plates and swapping the junk food for healthier options.

Danielle Baird, a Team Leader in Nutrition and Behaviour at CSIRO, contributed to this article.The Conversation

Matthew Ryan, Postdoctoral CERC Fellow, Human Health, CSIRO and Gilly Hendrie, Research Scientist, Human Health, CSIRO

This article is republished from The Conversation under a Creative Commons license. Read the original article.

Tuesday, 11 March 2025

Extreme Ocean swells and impact

How ocean giants are born: tracking the long-distance impact and danger of extreme swells

Strong waves originating from the North Pacific batter the promenade in Viña del Mar, Chile, on December 29 2024. Getty Images
Tom Shand, University of Auckland, Waipapa Taumata Rau

Late last year, a massive ocean swell caused by a low pressure system in the North Pacific generated waves up to 20 metres high, and damaged coastlines and property thousands of kilometres from its source.

Two years earlier, another storm system southeast of New Zealand also whipped up massive waves, with the swell reaching as far as Canada, battering Pacific island coasts along the way.

These storms, and the swells they create, are facts of nature. But while we understand a lot about the extraordinary forces at work, we can still do more to predict their impact and coordinate global warning systems.

How big waves are born

Waves are made by wind blowing over a water surface. The longer and stronger the wind blows, the more energy is transferred into those waves.

As well as an increase in wave height, sustained high wind speeds generate waves with a longer period – that is, the distance or time between successive wave crests. Oceanographers refer to the mix of wave heights and periods (and to some extent directions) as a “sea” state.

Once the wind stops blowing, or the sea moves away from the wind that is generating it, the waves become swell and start to separate. The longest-period waves move fastest and shorter-period waves more slowly.

Most waves resulting from a storm have periods of 12–16 seconds, with the individual waves travelling at speeds of 60–80km per hour.

But very large storms with high, sustained winds can generate waves with periods of more than 20 seconds. These waves travel much faster, over 100km per hour in the open ocean, and their energy (which travels more slowly than individual waves) can cover 1,500km in 24 hours.

Ocean waves, particularly long-period swells, lose very little energy as they travel. And unless they collide with an island and break, they are capable of travelling great distances.

By comparison, shorter period waves take much longer to travel and lose more energy. If they encounter a wind field moving in another direction, this also removes energy and reduces their height.

But sometimes, a particularly strong storm system can generate long-period waves with enough energy to travel across the Pacific, reaching shores thousands of kilometres away.

A unique characteristic of such long-range swells is that individual waves contain a lot more energy than shorter-period local waves. They grow to greater heights as they “shoal” in shallow water, and can hit shorelines and structures with greater force, causing more damage and danger.


Waves are generated by wind blowing over water with the distribution of energy changing dependent on their stage of evolution. CC BY-NC-ND

The ‘Code Red 2’ swell

The “Code Red 2” swell was a good example of this in action. It was generated by a massive storm system southeast of New Zealand in July 2022. The “significant wave height”, or average of the largest third of the system’s waves, reached 13 metres. Individual waves were up to twice this height.

The storm system was unusual due to very strong southerly winds blowing northweard from near Antarctica for over 2,000km. This resulted in long-period (20 second) swells moving north into the Pacific Ocean.

The swell first reached Tahiti, where waves closed most of the south-facing coast, prompting a Code Red warning. This was only the second such warning since 2011 (hence its name), and resulted in massive waves at the Teahupo'o surf break, location of the 2024 Olympic surfing event.

The swell also caused flooding along the south coast of Rarotonga and other Pacific Islands before continuing north across the equator to reach the south coast of Hawaii – 7,000km from where it was generated.

Due to their direction and very long period, large waves reached places they don’t usually affect, literally crashing weddings and breaking over houses. The swell then carried on to hit the Californian coast some 10,000km away, and eventually reaching Canada more than a week after it was initially generated.


Tracking the July 2022 Code Red II swell across the Pacific. CC BY-NC-ND

The ‘Eddie’ swell

More recently, the 2024 “Eddie” swell was generated from an extremely intense low pressure system in the North Pacific in December 2024. Waves near the centre of the storm reached heights of 20 metres, with a 22-second period.

The resulting swell hit Hawaii first, where waves were large enough to run the Eddie Aikau Big Wave Invitational at Waimea Bay, a surfing event that requires such large waves it has only been run 11 times in its 40-year history (and which gave the swell its name).

This extreme swell then reached California 3,000km away, where it also generated giant surf, damaged boats in coastal marinas and caused part of the Santa Cruz wharf to collapse.

Due to its very long period, the swell was able to continue southward, still with a lot of energy. It reached the north coast of Ecuador and Peru, 8,500km from where it began, where it destroyed fishing boats. And it finally hit Chile, 11,000km from its source, where it closed ports and inundated coastal promenades.

These coasts typically receive large southwest swells. But this rare, long-period north swell was able to reach normally protected north-facing sections of coast, causing uncharacteristic damage.


Tracking the December 2024 Eddie swell across the Pacific. CC BY-NC-ND

Predicting local impacts

It can be difficult to sound warnings for these types of long-period waves, as they are generated so far from the affected shorelines they are missed by local forecasters and emergency managers.

Global wave models such as those driven by the National Oceanic and Atmospheric Administration’s National Centers for Environmental Prediction are capable of predicting and tracking these swells but require a more nuanced approach to predicting local impacts.

New early warning systems are being developed that take global wave forecasts and downscale them to take into account the shape of the local coastline. The wave information is then combined with predictions of tide and storm surge to give warnings of when coastal impacts may occur.

These systems will give emergency managers, ports and coastal infrastructure operators – and the public – better information and more time to prepare for these damaging wave events.The Conversation

Tom Shand, Honorary Senior Lecturer, Department of Civil and Environmental Engineering, University of Auckland, Waipapa Taumata Rau

This article is republished from The Conversation under a Creative Commons license. Read the original article.

Thursday, 6 March 2025

Waste and recycling - what is needed

Australians generate mountains of waste, and we need more help to recycle and reuse it

Boy Anthony/Shutterstock
Melita Jazbec, University of Technology Sydney; Monique Retamal, University of Technology Sydney; Nick Florin, University of Technology Sydney, and Stuart White, University of Technology Sydney

Australians largely support transforming the economy to increase recycling, repurpose products and reduce waste, according to a new report from the Productivity Commission, but they are being impeded by inconsistent regulations.

The interim report of the commission’s inquiry into Australia’s circular economy, released Wednesday night, also finds consumers need more information about the durability and repairability of products.

The report says that despite increased awareness of the benefits of a circular economy, the transformation has been complex and progress has been slow.

What is a circular economy?

A circular economy is based on three principles.

The first is designing and making goods without waste and pollution. This includes using renewable energy to reduce carbon emissions.

The second is keeping products and materials in use for as long as possible. This can be achieved by maintaining or repairing products to extend their life.

The third principle is regeneration. This means promoting activities with positive outcomes. This could include activities to deal with biodiversity loss, or social benefits through food relief and donations.

Some businesses are already using circular economy practices but compared to other developed countries, Australia is well behind. The recent CSIRO study found only 3.7% of the Australian economy is circular, half of the world’s average of 7.2%.

In December last year the Federal government released the National Circular Economy Framework providing guidance how to increase circularity.

Coinciding with this, the Productivity Commission evaluated circular economy opportunities in six priority sectors – built environment, food and agriculture, textiles and clothing, vehicles, mining and electronics.


Priority areas

The priority areas were selected based on the impact their materials has on the environment and the economy.

For example, the construction sector uses large quantities of materials which are expensive to recycle. While the increased use of electric vehicles is a bonus for the environment, the lithium-ion batteries they use pose a fire risk if incorrectly managed.

How much impact a particular area has on Australia, was also taken into account.

For example, Australians are the largest consumers of textiles in the world per capita. But most of these are imported, limiting our influence on how they are made.

Also, the impact and effectiveness of policies and regulations was also considered. Stakeholders across government and community sectors provided detailed submissions that informed the commission’s assessment.

Getting consumers, government and business onboard

The Productivity Commission noted material consumption and waste generation has not changed since 2010. This is because consumers are not repairing and reusing appliances or recycling which is important to a circular economy.

Australia generates some of the highest amounts of waste per capita in the world, including food waste, plastic waste, e-waste and textile waste.

While the report recommends how food waste should be managed, consumers need to change their behaviour to reduce the waste they generate.

To do this, however, consumers need information about making informed purchasing decisions. For e-waste, they need easy access to repair services to extend the life of their products rather than buying new.

The report repeats earlier recommendations about repairs and reuse from the Productivity Commission’s 2021 Right to Repair inquiry.

That inquiry recommended the government develop a product labelling scheme giving consumers information about how durable household appliances are and whether they can be repaired.

We believe implementing these recommendations would bring Australia in line with global best practice reflected in the European Eco-design Sustainable Product regulations.

Impeded by regulations

This report highlights the importance of consistent policies and regulations. These currently vary across sectors and jurisdictions.

Standards enabling the use of recycled materials in construction, consistent rules on the disposal of lithium-ion batteries and consistent kerbside recycling guidelines were all needed.

The Circular Economy Ministerial Advisory Group recommended in their final report in December new legislation, a governance model and investment in innovation to help Australia move to a circular economy.

Help for business

When designed well, circular business models have the potential to reduce waste materials and carbon emissions.

Comparing the circular and linear economies. Productivity Commission, CC BY-SA

However, changing industry and consumer practices represents a big change. As well as inconsistent regulations slowing the transformation, making processes more innovative and experimenting with new technologies can be costly.

The Productivity Commission report says government can help reduce barriers to implementation of circular business models given business has a pivotal role in driving this transition.

It also supports product stewardship, an approach where producers, importers and brands are responsible and liable for the impact their products have on the environment and on human health across the product life cycle.

Regulations for product stewardship was identified in the report as important, particularly in textiles and clothing, vehicles, EV batteries, solar panels and consumer electronics.

Towards net zero

Several international studies have reported that a circular economy will be needed to achieve net zero targets.

In Australia, the industry sector including mining, manufacturing and construction is responsible for around 34% of total emissions. Using materials more efficiently will help reduce them.

Agriculture, despite its small contribution to the GDP (2.4%), alone contributes 18% to greenhouse gas emissions.

As the report notes, most of these emissions (80%) come from livestock and use of synthetic fertilisers (15%). But only food waste is identified as one of the priority areas.

Comparing the circular and linear economies

It should be noted though that food waste only accounts for 3% of emissions. So reducing emissions from agriculture, switching to renewable fertilisers and changing livestock diets should also be a priority.

The Productivity Commission will send its final report to government by August this year.The Conversation

Melita Jazbec, Research Director at the Institute for Sustainable Futures, University of Technology Sydney; Monique Retamal, Research Director, Institute for Sustainable Futures, University of Technology Sydney; Nick Florin, Associate Professor and Research Director, Institute for Sustainable Futures, University of Technology Sydney, and Stuart White, Director, Institute for Sustainable Futures, University of Technology Sydney

This article is republished from The Conversation under a Creative Commons license. Read the original article.

Tuesday, 18 February 2025

AI and the myths of safety

Nobody wants to talk about AI safety. Instead they cling to 5 comforting myths

Google Deepmind / Unsplash
Paul Salmon, University of the Sunshine Coast

This week, France hosted an AI Action Summit in Paris to discuss burning questions around artificial intelligence (AI), such as how people can trust AI technologies and how the world can govern them.

Sixty countries, including France, China, India, Japan, Australia and Canada, signed a declaration for “inclusive and sustainable” AI. The United Kingdom and United States notably refused to sign, with the UK saying the statement failed to address global governance and national security adequately, and US Vice President JD Vance criticising Europe’s “excessive regulation” of AI.

Critics say the summit sidelined safety concerns in favour of discussing commercial opportunities.

Last week, I attended the inaugural AI safety conference held by the International Association for Safe & Ethical AI, also in Paris, where I heard talks by AI luminaries Geoffrey Hinton, Yoshua Bengio, Anca Dragan, Margaret Mitchell, Max Tegmark, Kate Crawford, Joseph Stiglitz and Stuart Russell.

As I listened, I realised the disregard for AI safety concerns among governments and the public rests on a handful of comforting myths about AI that are no longer true – if they ever were.

1: Artificial general intelligence isn’t just science fiction

The most severe concerns about AI – that it could pose a threat to human existence – typically involve so-called artificial general intelligence (AGI). In theory, AGI will be far more advanced than current systems.

AGI systems will be able to learn, evolve and modify their own capabilities. They will be able to undertake tasks beyond those for which they were originally designed, and eventually surpass human intelligence.

AGI does not exist yet, and it is not certain it will ever be developed. Critics often dismiss AGI as something that belongs only in science fiction movies. As a result, the most critical risks are not taken seriously by some and are seen as fanciful by others.

However, many experts believe we are close to achieving AGI. Developers have suggested that, for the first time, they know what technical tasks are required to achieve the goal.

AGI will not stay solely in sci-fi forever. It will eventually be with us, and likely sooner than we think.

2: We already need to worry about current AI technologies

Given the most severe risks are often discussed in relation to AGI, there is often a misplaced belief we do not need to worry too much about the risks associated with contemporary “narrow” AI.

However, current AI technologies are already causing significant harm to humans and society. This includes through obvious mechanisms such as fatal road and aviation crashes, warfare, cyber incidents, and even encouraging suicide.

AI systems have also caused harm in more oblique ways, such as election interference, the replacement of human work, biased decision-making, deepfakes, and disinformation and misinformation.

According to MIT’s AI Incident Tracker, the harms caused by current AI technologies are on the rise. There is a critical need to manage current AI technologies as well as those that might appear in future.

3: Contemporary AI technologies are ‘smarter’ than we think

A third myth is that current AI technologies are not actually that clever and hence are easy to control. This myth is most often seen when discussing the large language models (LLMs) behind chatbots such as ChatGPT, Claude and Gemini.

There is plenty of debate about exactly how to define intelligence and whether AI technologies truly are intelligent, but for practical purposes these are distracting side issues. It is enough that AI systems behave in unexpected ways and create unforeseen risks.

Screenshot of a chat in which a chatbot appears to attempt to copy itself to a new computer when faced with the prospect of being shut down.
Several AI chatbots appear to display surprising behaviours, such as attempts at ‘scheming’ to ensure their own preservation. Apollo Research

For example, existing AI technologies have been found to engage in behaviours that most people would not expect from non-intelligent entities. These include deceit, collusion, hacking, and even acting to ensure their own preservation.

Whether these behaviours are evidence of intelligence is a moot point. The behaviours may cause harm to humans either way.

What matters is that we have the controls in place to prevent harmful behaviour. The idea that “AI is dumb” isn’t helping anyone.

4: Regulation alone is not enough

Many people concerned about AI safety have advocated for AI safety regulations.

Last year the European Union’s AI Act, representing the world’s first AI law, was widely praised. It built on already established AI safety principles to provide guidance around AI safety and risk.

While regulation is crucial, it is not all that’s required to ensure AI is safe and beneficial. Regulation is only part of a complex network of controls required to keep AI safe.

These controls will also include codes of practice, standards, research, education and training, performance measurement and evaluation, procedures, security and privacy controls, incident reporting and learning systems, and more. The EU AI act is a step in the right direction, but a huge amount of work is still required to develop the appropriate mechanisms required to ensure it works.

5: It’s not just about the AI

The fifth and perhaps most entrenched myth centres around the idea that AI technologies themselves create risk.

AI technologies form one component of a broader “sociotechnical” system. There are many other essential components: humans, other technologies, data, artefacts, organisations, procedures and so on.

Safety depends on the behaviour of all these components and their interactions. This “systems thinking” philosophy demands a different approach to AI safety.

Instead of controlling the behaviour of individual components of the system, we need to manage interactions and emergent properties.

With AI agents on the rise – AI systems with more autonomy and the ability to carry out more tasks – the interactions between different AI technologies will become increasingly important.

At present, there has been little work examining these interactions and the risks that could arise in the broader sociotechnical system in which AI technologies are deployed. AI safety controls are required for all interactions within the system, not just the AI technologies themselves.

AI safety is arguably one of the most important challenges our societies face. To get anywhere in addressing it, we will need a shared understanding of what the risks really are.The Conversation

Paul Salmon, Professor of Human Factors, University of the Sunshine Coast

This article is republished from The Conversation under a Creative Commons license. Read the original article.

Wednesday, 12 February 2025

Climate change - entering a new phase ?

Earth is already shooting through the 1.5°C global warming limit, two major studies show

Andrew King, The University of Melbourne and Liam Cassidy, The University of Melbourne

Earth is crossing the threshold of 1.5°C of global warming, according to two major global studies which together suggest the planet’s climate has likely entered a frightening new phase.

Under the landmark 2015 Paris Agreement on climate change, humanity is seeking to reduce greenhouse gas emissions and keep planetary heating to no more than 1.5°C above the pre-industrial average. In 2024, temperatures on Earth surpassed that limit.

This was not enough to declare the Paris threshold had been crossed, because the temperature goals under the agreement are measured over several decades, rather than short excursions over the 1.5°C mark.

But the two papers just released use a different measure. Both examined historical climate data to determine whether very hot years in the recent past were a sign that a future, long-term warming threshold would be breached.

The answer, alarmingly, was yes. The researchers say the record-hot 2024 indicates Earth is passing the 1.5°C limit, beyond which scientists predict catastrophic harm to the natural systems that support life on Earth.

2024: the first year of many above 1.5°C

Climate organisations around the world agree last year was the hottest on record. The global average temperature in 2024 was about 1.6°C above the average temperatures in the late-19th century, before humans started burning fossil fuels at large scale.

Earth has also recently experienced individual days and months above the 1.5°C warming mark.

But the global temperature varies from one year to the next. For example, the 2024 temperature spike, while in large part due to climate change, was also driven by a natural El Niño pattern early in the year. That pattern has dissipated for now, and 2025 is forecast to be a little cooler.

These year-to-year fluctuations mean climate scientists don’t view a single year exceeding the 1.5°C mark as a failure to meet the Paris Agreement.

However, the new studies published today in Nature Climate Change suggest even a single month or year at 1.5°C global warming may signify Earth is entering a long-term breach of that vital threshold.

What the studies found

The studies were conducted independently by researchers in Europe and Canada. They tackled the same basic question: is a year above 1.5°C global warming a warning sign that we’re already crossing the Paris Agreement threshold?

Both studies used observations and climate model simulations to address this question, with slightly different approaches.

In the European paper, the researchers looked at historical warming trends. They found when Earth’s average temperature reached a certain threshold, the following 20-year period also reached that threshold.

This pattern suggests that, given Earth reached 1.5°C warming last year, we may have entered a 20-year warming period when average temperatures will also reach 1.5°C.

The Canadian paper involved month-to-month data. June last year was the 12th consecutive month of temperatures above the 1.5°C warming level. The researcher found 12 consecutive months above a climate threshold indicates the threshold will be reached over the long term.

Both studies also demonstrate that even if stringent emissions reduction begins now, Earth is still likely to be crossing the 1.5°C threshold.

Heading in the wrong direction

Given these findings, what humanity does next is crucial.

For decades, climate scientists have warned burning fossil fuels for energy releases carbon dioxide and other gases that are warming the planet.

But humanity’s greenhouse gas emissions have continued to increase. Since the Intergovernmental Panel on Climate Change released its first report in 1990, the world’s annual carbon dioxide emissions have risen about 50%.

Put simply, we are not even moving in the right direction, let alone at the required pace.

The science shows greenhouse gas emissions must reach net-zero to end global warming. Even then, some aspects of the climate will continue to change for many centuries, because some regional warming, especially in the oceans, is already locked in and irreversible.

If Earth has indeed already crossed the 1.5°C mark, and humanity wants to get below the threshold again, we will need to cool the planet by reaching “net-negative emissions” – removing more greenhouse gases from the atmosphere than we emit. This would be a highly challenging task.

Feeling the heat

The damaging effects of climate change are already being felt across the globe. The harm will be even worse for future generations.

Australia has already experienced 1.5°C of warming, on average, since 1910.

Our unique ecosystems, such as the Great Barrier Reef, are already suffering because of this warming. Our oceans are hotter and seas are rising, hammering our coastlines and threatening marine life.

Bushfires and extreme weather, especially heatwaves, are becoming more frequent and severe. This puts pressure on nature, society and our economy.

But amid the gloom, there are signs of progress.

Across the world, renewable electricity generation is growing. Fossil fuel use has dropped in many countries. Technological developments are slowing emissions growth in polluting industries such as aviation and construction.

But clearly, there is much more work to be done.

Humanity can turn the tide

These studies are a sobering reminder of how far short humanity is falling in tackling climate change.

They show we must urgently adapt to further global warming. Among the suite of changes needed, richer nations must support the poorer countries set to bear the most severe climate harms. While some progress has been made in this regard, far more is needed.

A major shift is also needed to decarbonise our societies and economies. There is still room for hope, but we must not delay action. Otherwise, humanity will keep warming the planet and causing further damage.The Conversation

Andrew King, Associate Professor in Climate Science, ARC Centre of Excellence for 21st Century Weather, The University of Melbourne and Liam Cassidy, PhD Candidate, The University of Melbourne

This article is republished from The Conversation under a Creative Commons license. Read the original article.

Tuesday, 4 February 2025

Asteroid 2024/YR4 - a near earth miss but later possible collision ?

Astronomers have spied an asteroid that may be heading for Earth. Here’s what we know so far

Artist’s impression of an asteroid with Earth in the background. Buradaki / Shutterstock
Jonti Horner, University of Southern Queensland

On 27 December last year, astronomers using the ATLAS survey telescope in Chile discovered a small asteroid moving away from Earth. Follow up observations have revealed that the asteroid, 2024 YR4, is on a path that might lead to a collision with our planet on December 22 2032.

In other words, the newly-discovered space rock poses a significant impact threat to our planet.

It sounds like something from a bad Hollywood movie. But in reality, there’s no need to panic – this is just another day living on a target in a celestial shooting gallery.

So what’s the story? What do we know about 2024 YR4? And what would happen if it did collide with Earth?

A target in the celestial shooting gallery

As Earth moves around the Sun, it is continually encountering dust and debris that dates back to the birth of the Solar system. The system is littered with such debris, and the meteors and fireballs seen every night are evidence of just how polluted our local neighbourhood is.

But most of the debris is far too small to cause problems to life on Earth. There is far more tiny debris out there than larger chunks – so impacts from objects that could imperil life on Earth’s surface are much less frequent.

The most famous impact came some 66 million years ago. A giant rock from space, at least 10 kilometres in diameter, crashed into Earth – causing a mass extinction that wiped out something like 75% of all species on Earth.

Impacts that large are, fortunately, very rare events. Current estimates suggest that objects like the one which killed the dinosaurs only hit Earth every 50 million years or so. Smaller impacts, though, are more common.

On June 30 1908, there was a vast explosion in a sparsely populated part of Siberia. When explorers later reached the location of the explosion, they found an astonishing site: a forest levelled, with all the trees fallen in the same direction. As they moved around, the direction of the fallen trees changed – all pointing inwards towards the epicentre of the explosion.

Old photo of flattened trees in a forest.
The Tunguska event flattened trees over an area of around 2,200 square kilometres. Leonid Kulik / Wikimedia

In total, the Tunguska event levelled an area of almost 2,200 square kilometres – roughly equivalent to the area of greater Sydney. Fortunately, that forest was extremely remote. While plants and animals were killed in the blast zone, it is thought that, at most, only three people perished.

Estimates vary of how frequent such large collisions should be. Some argue that Earth should experience a similar impact, on average, once per century. Others suggest such collisions might only happen every 10,000 years or so. The truth is we don’t know – but that’s part of the fun of science.

More recently, a smaller impact created global excitement. On 15 February 2013, a small asteroid (likely about 18 metres in diameter) detonated near the Russian city of Chelyabinsk.

The explosion, about 30 kilometres above the Earth’s surface, generated a powerful shock-wave and extremely bright flash of light. Buildings were damaged, windows smashed, and almost 1,500 people were injured – although there were no fatalities.

It served as a reminder, however, that Earth will be hit again. It’s only a question of when.

Which brings us to our latest contender – asteroid 2024 YR4.

The 1-in-77 chance of collision to watch

2024 YR4 has been under close observation by astronomers for a little over a month. It was discovered just a few days after making a relatively close approach to our planet, and it is now receding into the dark depths of the Solar System. By April, it will be lost to even the world’s largest telescopes.

The observations carried out over the past month have allowed astronomers to extrapolate the asteroid’s motion forward over time, working out its orbit around the Sun. As a result, it has become clear that, on December 22 2032, it will pass very close to our planet – and may even collide with us.

A map of Earth showing a red streak stretching from Central America to Southeast Asia.
The area at risk of a strike, based on current (highly uncertain) data. Daniel Bamberger / Wikimedia, CC BY-SA

At present, our best models of the asteroid’s motion have an uncertainty of around 100,000 kilometres in its position at the time it would be closest to Earth. At around 12,000 kilometres in diameter, our planet falls inside that region of uncertainty.

Calculations suggest there is currently around a 1-in-77 chance that the asteroid will crash into our planet at that time. Of course, that means there is still a 76-in-77 chance it will miss us.

When will we know for sure?

With every new observation of 2024 YR4, astronomers’ knowledge of its orbit improves slightly – which is why the collision likelihoods you might see quoted online keep changing. We’ll be able to follow the asteroid as it recedes from Earth for another couple of months, by which time we’ll have a better idea of exactly where it will be on that fateful day in December 2032.

But it is unlikely we’ll be able to say for sure whether we’re in the clear at that point.

Video showing a faint dot in the middle of a background of moving stars
Recent observations of 2024 YR4 – the faint unmoving dot in the centre of the image. ESO, CC BY

Fortunately, the asteroid will make another close approach to the Earth in December 2028 – passing around 8 million kilometres from our planet. Astronomers will be ready to perform a wide raft of observations that will help us to understand the size and shape of the asteroid, as well as giving an incredibly accurate overview of where it will be in 2032.

At the end of that encounter, we will know for sure whether there will be a collision in 2032. And if there is to be a collision that year, we’ll be able to predict where on Earth that collision will be – likely to a precision of a few tens of kilometres.

How big would the impact be?

At the moment, we don’t know the exact size of 2024 YR4. Even through Earth’s largest telescopes, it is just a single tiny speck in the sky. So we have to estimate its size based on its brightness. Depending on how reflective the asteroid is, current estimates place it as being somewhere between 40 and 100 metres across.

What does that mean for a potential impact? Well, it would depend on exactly what the asteroid is made of.

The most likely scenario is that the asteroid is a rocky pile of rubble. If that turns out to be the case, then the impact would be very similar to the Tunguska event in 1908.

The asteroid would detonate in the atmosphere, with a shockwave blasting Earth’s surface as a result. The Tunguska impact was a “city killer” type event, levelling forest across a city-sized patch of land.

Satellite photo of a large rocky crater.
Meteor Crater in Arizona is believed to have been created by a 50m metallic meteorite impact around 50,000 years ago. NASA Earth Observatory / Wikimedia

A less likely possibility is that the asteroid is made of metal. Based on its orbit around the Sun, this seems unlikely – but we can’t rule it out.

In that case, the asteroid would make it through the atmosphere intact, and crash into Earth’s surface. If it hit on the land, it would carve out a new impact crater, probably more than a kilometre across and a couple of hundred metres deep – something similar to Meteor Crater in Arizona.

Again, this would be quite spectacular for the region around the impact – but that would be about it.

Living in a remarkable time

This all sounds like doom and gloom. After all, we know that the Earth will be hit again – either by 2024 YR4 or something else. But there’s a real positive to take out of all this.

There has been life on Earth for more than 3 billion years. In all that time, impacts have come along and caused destruction and devastation many times.

But there has never been a species, to our knowledge, that understood the risk, could detect potential threats in advance, and even do something about the threat. Until now.

In just the past few years, we have discovered 11 asteroids before they hit our planet. In each case, we have predicted where they would hit, and watched the results.

We have also, in recent years, demonstrated a growing capacity to deflect potentially threatening asteroids. NASA’s DART mission (the Double Asteroid Redirection Test) was an astounding success.

For the first time in more than 3 billion years of life on Earth, we can do something about the risk posed by rocks from space. So don’t panic! But instead, sit back and watch the show.The Conversation

Jonti Horner, Professor (Astrophysics), University of Southern Queensland

This article is republished from The Conversation under a Creative Commons license. Read the original article.

Avocadoes - the types

 What’s the difference between Hass and Shepard avocados? It’s not just the colour

Stepanenco Valeria/Unsplash
Yasmine Probst, University of Wollongong and Karen Zoszak, University of Wollongong

Whether with crumbled feta or poached eggs, you’d be challenged to find a cafe in Australia or farther afield that doesn’t have avocado somewhere on the menu.

This fruit (yep, it’s a fruit from a tree, not a vegetable) is widely associated with brunch culture and other trendy eating habits.

The Australian avocado industry developed in the 1960s, 30 years after the start of the first large-scale production in California. Orchards producing avocados now span most parts of Australia.

Avocados are considered a monoculture crop: they’re grown on the same land each year, making them more susceptible to pests and creating a need for increased fertiliser use. The carbon footprint of avos is almost twice as high as that of apples, but much lower than many animal food sources.

There are now over 50 different avocado types globally, but only a few are grown commercially.

Not all avos are the same

You may not notice a difference when you get your avocado toast at a cafe. But at the shops or the market, a striking difference occurs each year in Australia.

In autumn, the familiar dark purple Hass avocado disappears and is replaced with the lighter green Shepard variety. In Australia, this typically happens between February and May.

If you don’t know the difference between the two, you may expect Shepard avos to perform the same way as Hass – and be left disappointed. There are some important differences.

Hass avocados

A pile of dark avocados on a cutting board with one cut open in the foreground.
Hass avocado skin is very dark when ripe. Nungning20/Shutterstock

Hass avocados are known for their dark, pebbly-looking skin that appears almost black when ripe. They have an ovoid shape with a slight pear-like appearance. The thick skin can be a challenge to peel, often requiring a sharp knife or avocado slicer.

Hass avocado flavour is rich, creamy and buttery, with nutty undertones. Their texture is ideal for mashing, blending and spreading, creating a creamy texture in dips, guacamole and smoothies.

Hass avocados ripen – and darken in colour – slowly over several days. They remain firm to the touch when ripe, and will feel squishy when overripe. A slight give when pressed confirms Hass avos are ready to eat.

Available in Australia from May to January, Hass are the dominant variety of commercially grown avocado worldwide. They were cultivated by horticulturalist Rudolph Hass in California in the 1920s.

Shepard avocados

Shepard avocados have smooth, green skin that remains green even when they are fully ripe. They are round to slightly oblong in shape and have a slightly milder and sweeter taste, with less pronounced nutty undertones.

Shepard avocados ripen more quickly than Hass, but you won’t be able to tell that by the colour. Instead, check for softness – Shepard avocados are very soft when ripe. What might feel overripe when handling a Hass will likely be ideal ripeness if it’s a Shepard. The thin, smooth skin makes them easy to peel by hand or with a gentle squeeze.

Their buttery soft texture is firm and creamy, and they hold their shape well when cut, making them ideal for slicing, dicing and spreading despite being structurally firm.

Interestingly, Shepard avocados brown much more slowly than Hass, making them perfect for garnishes. Their milder flavour also makes Shepard avos well suited to sweet dishes, such as chocolate mousse.

Shepard avos account for approximately 10–15% of Australian avocados and are in season from February to April each year while there is a gap in the Hass season.

Australia is the only country in the world that grows Shepard avocados commercially. (They are grown in Queensland.)

Avocados and our health

As avocados contain roughly 13 grams of fat per 100g, people wishing to lose weight were previously advised to avoid or limit eating them.

We now know that a majority of this fat is oleic acid, a monounsaturated (healthy) fat that helps to reduce cholesterol and improve heart health.

Additionally, only 1% of an avocado is made up of carbohydrates, making the fruit popular with people following a ketogenic (keto) diet of low carbs and high fat.

People who consume avos also tend to follow a better pattern of eating in general. They eat more whole grains, fruit and vegetables and fewer discretionary or takeaway foods.

As an energy-dense food, consuming a whole avocado is about the same as eating 2.5 whole apples. Per 100 grams, avocado actually gives you less energy than an equivalent amount of cooked white rice.

As avocado dishes are visually appealing and often featured in food photography, they have become a symbol of modern eating habits.

Correction: this article has been amended to clarify that most parts of Australia now have avocado orchards, and that avocados have roughly 13g of fat per 100g, not 53%.The Conversation

Yasmine Probst, Professor, School of Medical, Indigenous and Health Sciences, University of Wollongong and Karen Zoszak, Accredited Practising Dietitian, PhD Candidate, University of Wollongong

This article is republished from The Conversation under a Creative Commons license. Read the original article.