
Trees and greenery can cool cities by as much as 18°C – but only if they’re the right type
Cities around the world are planting more trees to cope with rising urban heat. But our research shows trees alone are often not enough. In some cases, the wrong kind of greening can even make streets feel less comfortable on a hot day.
We compared field measurements from Melbourne, Munich and Hong Kong to test how different kinds of urban planting changed the heat people experience outdoors.
The results showed layered vegetation – where trees are combined with shrubs and ground cover – often cooled cities more effectively than trees alone. We also found local climate and street design strongly shaped whether greening worked well.
These findings matter because urban greening is no longer just about aesthetics. As cities spend billions adapting to extreme heat, planting design may matter as much as planting quantity.
Cities are getting hotter
Cities trap heat. Roads, buildings and asphalt absorb solar energy during the day and slowly release it back into the air, especially at night.
This “urban heat island” effect, combined with climate change, is making heatwaves more intense and more dangerous in our cities.
Trees are one of the most popular responses because they provide shade and reduce the amount of heat absorbed by surrounding surfaces. But outdoor comfort depends on more than air temperature alone.
People experience heat through sunlight, reflected heat, humidity and airflow. A shaded street can still feel uncomfortable if humidity is high or if wind cannot move through the space.
That is why a “one-size fits all” greening strategy can fail. A planting design that works well in Melbourne may behave very differently in Hong Kong or Munich.
What we found
To better understand how urban vegetation affects heat stress, we did field measurements in three cities with different climates: temperate Melbourne, cooler Munich and humid subtropical Hong Kong.
Rather than relying only on computer models, we measured real conditions in streets and green spaces during summer.
We compared open urban spaces (with no plantings), sites with trees only, and layered planting (which means trees, shrubs and ground cover together).
Importantly, we did not just measure air temperature. We also measured “mean radiant temperature”, which captures the heat radiating from roads, walls and other surfaces onto the human body.
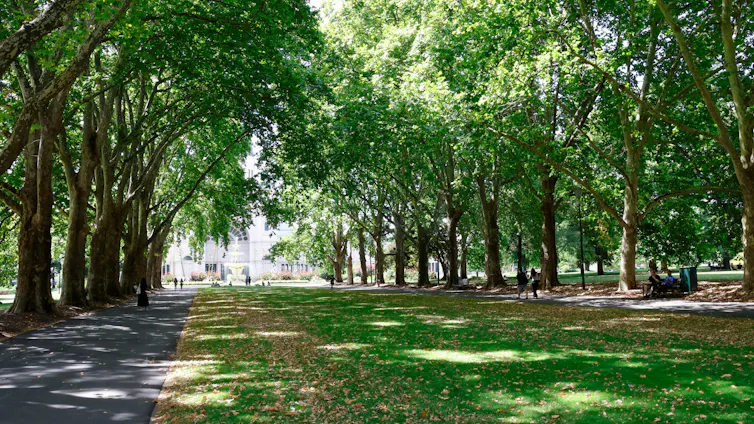
In Melbourne, street trees reduced radiant heat absorbed by pedestrians by more than 18°C, compared with open streets. Even where air temperatures changed only slightly, shaded streets felt substantially cooler.
Munich showed the strongest benefits from layered planting. There, streets and green spaces containing trees, shrubs and ground cover reduced afternoon heat stress by almost 8°C compared with more open spaces.
Hong Kong also benefited from vegetation, especially through shade created by overlapping tree canopies. But the results there were more mixed because the humid climate changed how cooling worked (more on that later).
Across all three cities, one finding stood out: vegetation structure matters.
Combining trees with shrubs and ground cover often performed better than trees alone, but the benefits depended on how the planting interacted with the local environment.
Why some greening can fail
The study showed that more vegetation is not automatically better.
In Hong Kong, dense vegetation sometimes increased humidity enough to reduce some of the cooling benefit. Plants release water vapour into the air through transpiration, which can help to cool dry climates. But in already humid cities, extra moisture can make outdoor spaces feel sticky and uncomfortable because sweat evaporates less efficiently.
In some Munich streets, dense vegetation reduced airflow through narrow urban corridors, trapping warm air and slowing the movement of vehicle pollution away from pedestrians.
These findings highlight why cities cannot rely on generic canopy targets copied from elsewhere. Climate, street width and airflow all shape whether vegetation improves comfort or creates unintended side effects.
Designing cooler cities
The solution is not to stop planting trees. It is to design urban greening more carefully.
Cities need planting strategies tailored to local conditions rather than universal greening formulas. In parks and open green spaces, layered vegetation can provide strong cooling while also supporting biodiversity. In dense streets, planners may need to balance shade with ventilation.
The findings also suggest cities should move beyond measuring success through tree numbers alone. The arrangement, density and type of vegetation matter just as much as canopy cover.
Designing for local conditions
Our research shows urban vegetation can reduce heat stress, but the benefits depend on how and where cities plant it.
Melbourne demonstrated the strong cooling effect of street trees on radiant heat, Munich showed the added value of layered vegetation, and Hong Kong revealed how dense planting can sometimes backfire in humid conditions.
Cities need climate-smart green spaces designed for local conditions, airflow and human comfort to remain liveable as temperatures rise.![]()
Mohammad A Rahman, Senior Lecturer in Urban Horticulture, The University of Melbourne
This article is republished from The Conversation under a Creative Commons license. Read the original article.


